Brownian Motion Part II
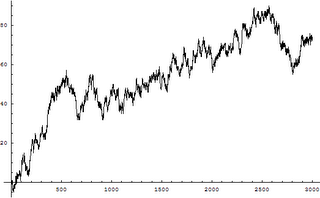
As I said in my last post regarding the section in which we were discussing Brownian motion, I was working on using mathematica to graph an illsutration of what Brownian motion looked like. As we discussed in class it looks very much like a Stock Market diagram (and in fact Brownian Motion is a large part of Economics and Finance). I was able to complete this task and constructed a graph of a random walk to illustrate Brownian motion in one dimension.
- One Dimensional "Drunkards Walk"

- In the example above the points are disconnected, but since they are so close together, you can still see the outline of the graph.
- In the example below I have connected the points and exectued the same piece of code. Each time it is executed, a new graph is formed due to the natural randomness of brownian motion.

- Code:
RandomWalk[n_] := NestList[(# + (-1)^Random[Integer]) &, 0, n];
ListPlot[RandomWalk[3000], PlotJoined -> True]
This is a cool website I came across with small applets showing both one and two dimensional brownian motion: Click Here
In class we did a sort of extended proof that Brownian motion exists (about 2.5 class sessions). This proof had, what seemed to be quite a bit of statistics involved in it and I will not attempt to rewrite the 5 pages of notes I have on it in this blog. I will however discuss what I got out of those classes:
- Brownian motion exists.
This was the conclusion we came to in our extended proof. - The paths of Brownian motion are continuous.
This would be fairly easy to justify with the definition of continous. - The paths are non-differentiable anywhere.
Holy cow! Continous, but not differentiable anwhere? - The paths to Brownian motion are fractals.
Ah, yes. What I was waiting for all along, a tie in to fractals. This webpage made this part a little more clear in my eyes. It states that Brownian motion is self-similar in law, then has an applet which zooms in continuously on a random walk. You can see that the graph stretches a bit, but keeps it's generaly shape no matter how much you zoom in.


0 Comments:
Post a Comment
<< Home